Services :: Example Projects
Medium Range Temperature Forecast Support
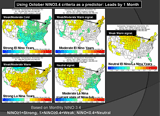
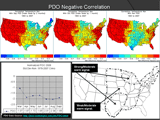
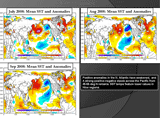
We have ongoing work with a client in the financial services sector to support temperature prediction. The primary impetus for this work is the effect of extreme temperatures on energy demand. We use many of the web-based tools at NOAA’s Earth System Research Laboratory to analyze statistical correlations between various teleconnections. We have also completed composite and case studies of extremes, including the examinations of precursor conditions to major cold-air outbreaks and summer heat episodes. We have also performed unique research on the connections between the Madden-Julian Oscillation (MJO) and its influence on regional United States temperatures.
Forensic Investigations
We have provided weather information and analysis for legal cases involving weather-sensitive conditions. This analysis focuses on analyzing and determining weather information at specific times and places. These cases have included slip and falls, and untimely deaths potentially attributed to anomalous weather conditions.
Road Weather
We are currently working with the State of Vermont and its agency of Transportation (VTrans) to provide winter weather forecast information. This information is used by Vermont’s nine district garages to effectively manage their operations, optimizing safety and efficiency. We issue daily weather forecasts specific to Vermont’s complex terrain and road weather conditions
Examples of past forecasts
Saturday
Wednesday
Light snow showers will continue across the area. Then between noon and 3 PM expect snow to start mixing with sleet, at this time until about 8PM there will be a lull in the action and only light snow/sleet showers will be around. Expect 1 - 3" of snow/sleet accumulation. The heaviest precipitation is going to fall between 8PM and 1AM, where the precipitation will fall as rain. .2 to .3 inches of rain will fall during this time.
Climate Atlas
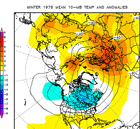
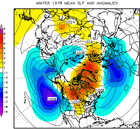
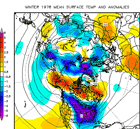
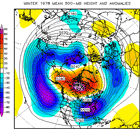
We developed a web-based interface displaying monthly and seasonal parameters using the NCEP-NCAR Reanalysis. This virtual atlas allows the client to quickly and readily visualize various parameters. For example, one can quickly see the surface temperature anomalies over the Northern Hemisphere for winters back to 1948. VIAM developed the customized graphics, the web-based interface, and hosts the password-protected web page.
Climate Change and Hydroelectric Impacts
We have conducted work analyzing climate trends and its effects on hydroelectric production. This included a multi-linear statistical seasonal analysis of temperature and precipitation data versus hydroelectric generation.
