
Downloads:
Ground and Aerial EF-Ratings: Moore_ratings (KMZ) Tree fall vectors: Tree-vectors (KMZ)
Note: Due to saving issued in Google Earth, the file may open over Africa. You must manually enter Moore, OK in the search box after opening. Moore_ratings KMZ contains both aerial and ground rating points.
Abstract
An integrated damage, visual, and radar analysis of the EF5 Moore Oklahoma tornado that occurred on 20 May 2013 is presented. Characteristics of the damage path are discussed based on detailed ground and aerial surveys. Tree fall reveals highly convergent surface flow over the majority of the damage path. At times, the convergent flow is observed at radii less than that of the condensation funnel. A photogrammetric analysis of still photos and video show that the damaging winds extend well beyond the condensation funnel location. The condensation funnel often coincides with the EF1, EF2, and EF3 isopleths.
Observations of the tornado debris signature (TDS) by the Twin Lakes Weather Surveillance Radar (KTLX) – 1988 Doppler (WSR-88D) are presented. The TDS is not a good indicator of tornado intensity just after tornadogenesis. The spatial relationship between the TDS, condensation funnel, and damage path is also shown.
An analysis of the area encompassed by the respective EF-scale isopleths is presented to quantify damage risk. The area of successively weaker EF-scale categories exponentially increases. These results are compared to other well-surveyed EF5 tornadoes.
A comparison is made between independent ground and aerial surveys that rated 4039 structures along the entire damage path. The aerial survey produces a low bias in EF0 and EF1 ratings. No apparent bias is observed in the EF2-4 categories. It is not possible to draw definitive conclusions concerning the small number of EF5 rated structures.
Introduction
The most violent of all tornadoes, those rated F5 (Fujita 1971) or EF5 on the recently created Enhanced Fujita scale (WSEC 2006), are a rare occurrence. Only 0.13% of all tornadoes observed from 1950–2007 over the contiguous United States were rated F5 or EF5 (Simmons and Sutter 2011). Yet, their economic and societal impact can be devastating. Adjusted for inflation (constant 2014 dollars), the F5 Bridge Creek-Moore Oklahoma tornado on 3 May 1999 produced $1.3 billion in damage (Brooks and Doswell 2001). During the recent 2011 tornado season, the EF5 Joplin tornado resulted in 158 direct fatalities (Simmons and Sutter 2012) and approximately $3 billion in insured losses (Simmons et al. 2013).
The value of performing tornado damage surveys is well established (Fujita 1981; Bluestein and Golden 1993). It is particularly important to survey high-impact events as has been done in the past for the 3 May 1999 Moore-Bridge Creek Oklahoma (Marshall 2002; Speheger et al. 2002), 4 May 2007 Greensburg, Kansas (Marshall et al. 2008b), 22 May 2011 Joplin, Missouri (NOAA 2011) and 27 April 2011 Tuscaloosca-Birmingham, Alabama (Karstens et al. 2013) tornadoes, and many other historical cases. Much has been learned from these and other damage survey studies regarding the low-level tornado wind field (Karstens et al. 2013) and attendant damage (Wurman and Alexander 2005), structure failure (Marshall 2002, Marshall et al. 2008a), distribution of risk in the damage path (Abbey and Fujita 1975; Speheger et al. 2002), non-linear damage markings (Wakimoto et al. 2003; Marshall et al. 2008b), and the relationship between the condensation funnel, the damage path, and radar observations (Wakimoto et al. 2003).
On 20 May 2013, an EF5 tornado formed over northern Newcastle, Oklahoma and subsequently moved east-northeast into Moore. The tornado eventually dissipated in the rural countryside just west of Stanley Draper Lake. This is the third violent tornado that has impacted the greater Moore area since 1999. The economic and societal impacts of the 2013 Moore tornado cannot be overstated. The tornado is responsible for 24 fatalities (https://www.ncdc.noaa.gov/stormevents/). Total damage loss is estimated to be $2-3.5 billion (http://www.propertycasualty360.com/2013/05/28/2-35b-in-insured-losses-from-moore-oklahoma-tornad) by Risk Management Solutions. Of the 4531 structures that were damaged, 78% are residential buildings assessed at approximately $400 million. Tragically, two elementary schools within the city of Moore, Briarwood Elementary and Plaza Towers, were completely destroyed by the tornado. Seven of the fatalities were children in the Plaza Towers Elementary school. The Moore Medical Center was also destroyed by the tornado.
Comprehensive and independent ground and aerial damage surveys were conducted in the days and weeks after the event. Synthesis of the damage survey data, visual observations, and dual-polarized KTLX radar data allows for the following two objectives to be investigated. The first is to document the damage produced by this historic event and examine the spatial relationship between the damage, visual characteristics, and dual-polarization observations of the tornado. The second is to quantitatively compare results from independent aerial and ground damage surveys. This objective is especially relevant, as recent studies have begun to examine the utility of satellite and aerial data to supplement and possibly replace ground surveys (Edwards et al. 2013).
Data Analysis Methodology
Damage Survey
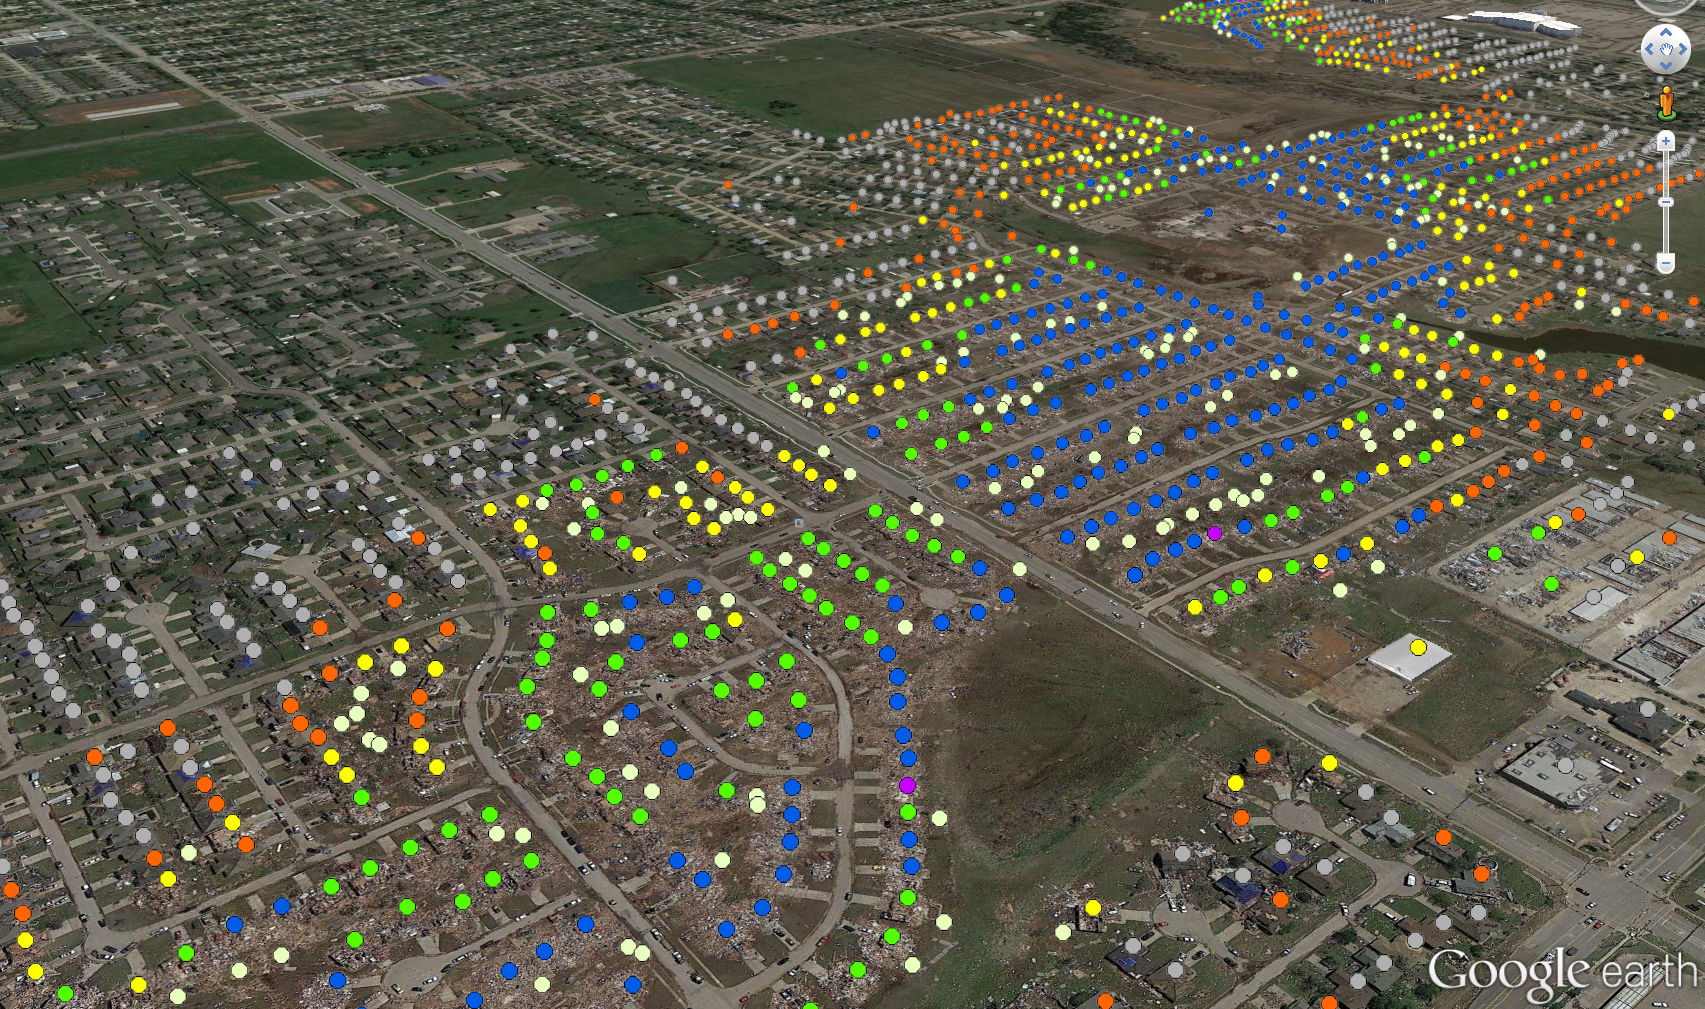
Independent ground and aerial surveys commenced immediately after the Moore tornado. Detailed aerial surveys were performed on 21 and 22 May 2013. The aerial survey on 22 May 2013 was performed by the authors in a Cessna 172 aircraft flown at approximately 305, 1220, and 1,830 m above ground level (AGL). A total of 1177 high-resolution digital SLR photographs were taken as the aircraft slowly circled over the damage path for approximately four hours. Damage in the photographs was then plotted onto 7.5 minute-scale United States Geological Survey (USGS) topographic maps and in ArcGIS. The National Weather Service EF kit (LaDue and Mahoney 2006) was used to give damage points an EF value. Satellite and Street View imagery available in Google Earth were also used extensively to ascertain the type of structures in some of the most heavily damaged areas (Fig. I). Directions of tree fall, debris, and tornado swath marks were also plotted using the aerial photos and 15-cm resolution satellite imagery taken on 21 May 2013, viewable in Google Earth.
An independent ground survey of the 2013 Moore tornado was completed by teams affiliated with the National Weather Center (Burgess et al. 2014). Data from the independent ground and aerial surveys were then checked for consistency. The two surveys were merged to produce a comprehensive and consistent map of the damage path.
Photogrammetry
While photogrammetry and research teams equipped with mobile radars were operable on 20 May 2013, they did not deploy on the Moore storm since it would have required deployment in urban areas¨. Social media was used to collect imagery and video from amateur storm chasers and news crews. Azimuth and elevation grids were superimposed on select photographs and video frames (Fig. II) using photogrammetric techniques that are well documented in the literature (e.g., Rasmussen et al. 2003; Zehnder et al. 2007; Wakimoto et al. 2011; Atkins et al. 2012). By measuring the azimuth angles of known landmarks in the photos, the grid uncertainty is estimated to be 0.1°.
It is possible to estimate the condensation funnel diameter (e.g., Wakimoto et al. 2011; Atkins et al. 2012) by triangulation in concurrent photos taken at two or more vantage points. Unfortunately, triangulation is not possible with the available photos of the Moore tornado. The funnel diameter may also be estimated by measuring the azimuth angle,Φ across the funnel, and the range, R from the photographer to the condensation funnel. To estimate the range from the photographer to the tornado, it is assumed that the condensation funnel center is collocated with the damage path centerline. Uncertainty in the funnel diameter calculation is dependent on R and associated uncertainty, dR. It also depends on the uncertainty, dΦ in the azimuth angle across the funnel, estimate to be 0.2°. The photographer GPS locations were independently verified by a site survey after the Moore event. By using the available GPS coordinates provided by the photographers along with the locations of objects in the background and foreground of the respective photos, the photographer locations were determined to within 1.5 meters. Uncertainty in the damage path location is estimated to be 10 meters. Therefore, dR is estimated to be 11.5 meters.
It is possible to estimate the condensation funnel diameter (e.g., Wakimoto et al. 2011; Atkins et al. 2012) by triangulation in concurrent photos taken at two or more vantage points. Unfortunately, triangulation is not possible with the available photos of the Moore tornado. The funnel diameter may also be estimated by measuring the azimuth angle,Φ across the funnel, and the range, R from the photographer to the condensation funnel. To estimate the range from the photographer to the tornado, it is assumed that the condensation funnel center is collocated with the damage path centerline. Uncertainty in the funnel diameter calculation is dependent on R and associated uncertainty, dR. It also depends on the uncertainty, dΦ in the azimuth angle across the funnel, estimate to be 0.2°. The photographer GPS locations were independently verified by a site survey after the Moore event. By using the available GPS coordinates provided by the photographers along with the locations of objects in the background and foreground of the respective photos, the photographer locations were determined to within 1.5 meters. Uncertainty in the damage path location is estimated to be 10 meters. Therefore, dR is estimated to be 11.5 meters.

Figure II. Azimuth and elevation grid superimposed using photogrammetric techniques. Photo by Robert Fritchie
Radar Data
While there were a number of radars operated by The University of Oklahoma (OU), The National Oceanic and Atmospheric Administration (NOAA), and the Federal Aviation Administration (FAA) that collected data on the Moore tornado, the dual-polarized WSR-88D KTLX data was chosen for analysis. The radar reflectivity and co-polar cross correlation coefficient were objectively analyzed to a Cartesian grid using a two-pass Barnes filter (Koch et al. 1983). The filter and grid parameters were chosen based on the data resolution, d, at the range of the tornado. The KTLX data are oversampled every 0.5° in azimuth. The range from the radar to the tornado varied from 30.6 km at 1955:27 UTC (near the time of tornadogenesis; hereafter all times are UTC) to 11.9 km at 2033:46 UTC (near the time of tornado demise). This results in d varying from 0.534 to 0.208 km. The smoothing parameter [κ = (1.33δ)^2; Pauley and Wu 1990] and grid spacing (Δ = δ/2.5; Koch et al. 1983) were set appropriately. Only the 0.5° elevation angle scan was included in the analysis.
Results
Damage Survey, Visual, and Radar Observations
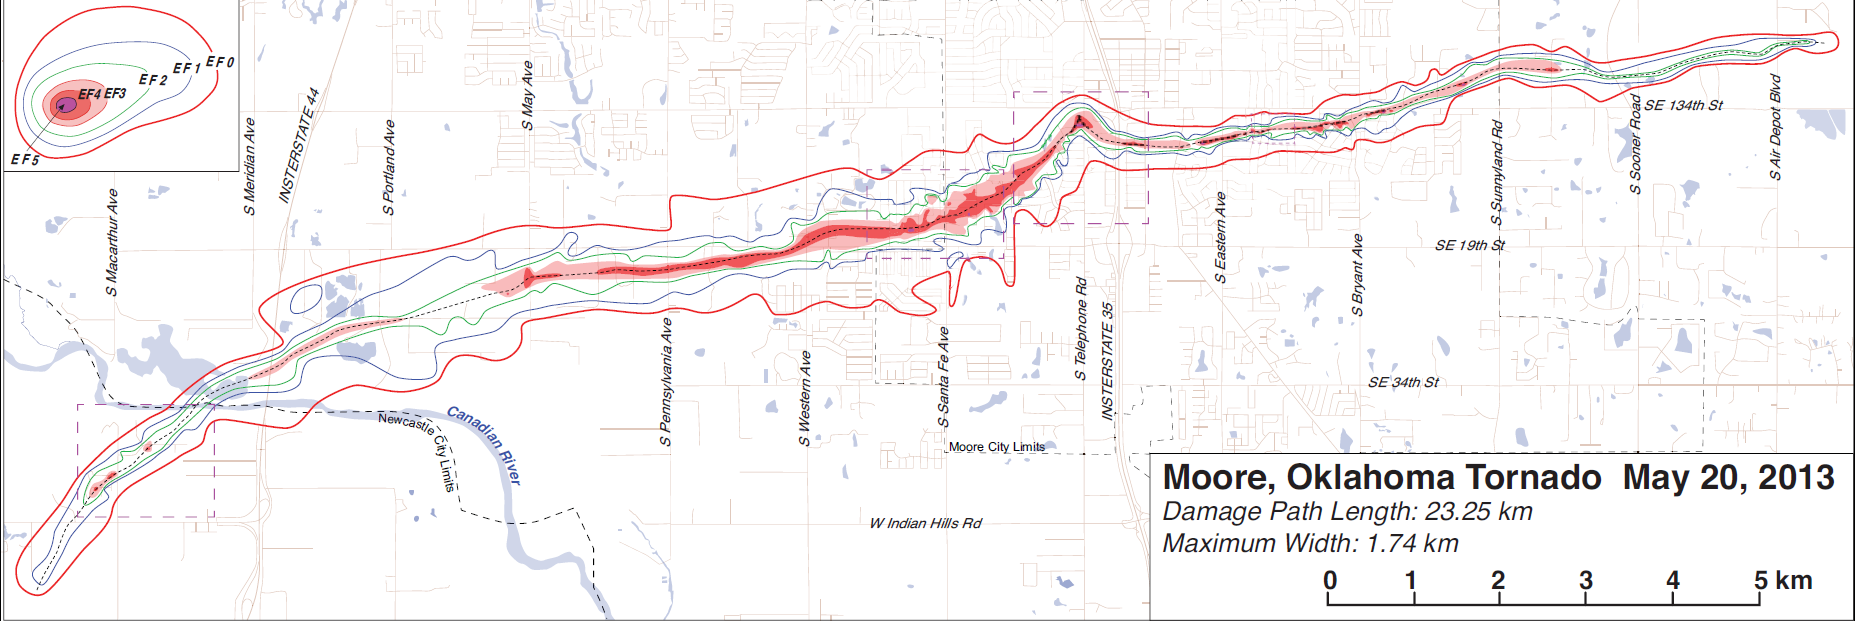
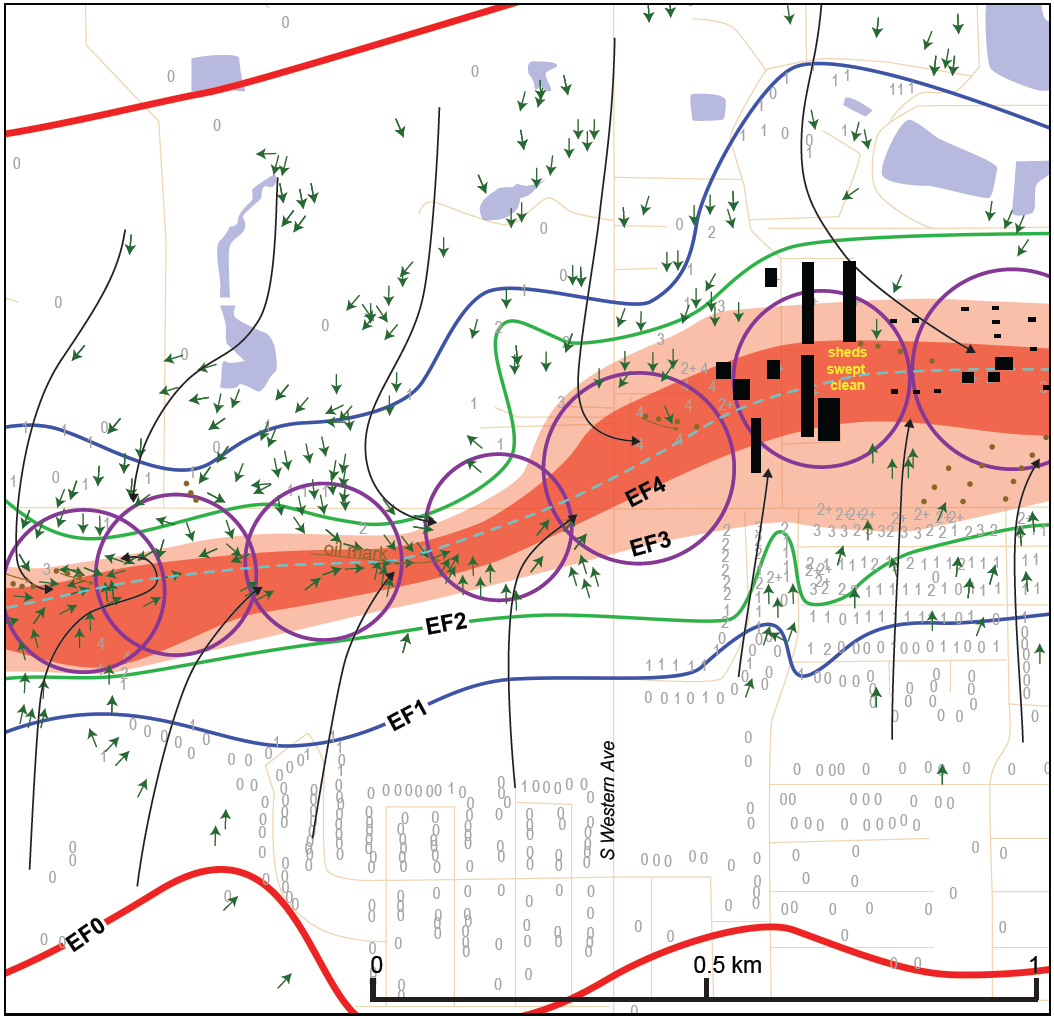
The Moore tornado began producing EF0 damage in northern Newcastle at approximately 1956 UTC (Fig. 1)˜. The tornado subsequently moved east-northeast passing through the city of Moore eventually dissipating 4 km east of the Moore city limits. EF2 damage is observed along nearly the entire damage path. EF3 and 4 damage is observed within 1.6 km (4 minutes) of the beginning of the damage path. The damage path abruptly widens after the tornado passed east of Interstate 44 in South Oklahoma City. EF3 and EF4 damage is observed nearly continuously for approximately 13 km beginning just west of South May Avenue. Much of this damage was produced in rural portions of South Oklahoma City and suburban neighborhoods in Moore. EF4 damage was observed at the Briarwood and Plaza Towers elementary schools and in suburban neighborhoods in Moore. Two homes just east of the Briarwood elementary school were rated EF5 by the National Weather Center teams. A prominent cusp in the damage path is located just west of Interstate 35, also associated with EF5 damage. A small loop of the tornado centerline is observed within the cusp and is inferred by debris furrowing (shown in more detail in Fig. 5). Rapidly updating mobile Doppler radar measurements confirm that the tornado couplet location loops within the cusp just west of Interstate 35 (Kurdzo et al. 2014). As the tornado moved east of Interstate 35, the damage path noticeably narrows. Large damage gradients are observed along this portion of the damage track. EF4 and EF5 damage is observed just west and east of South Sunnyland Road in eastern Moore. The damage path length is 23.25 km. While the path width is quite variable, the maximum width of 1.74 km is located over South Oklahoma City and western Moore.
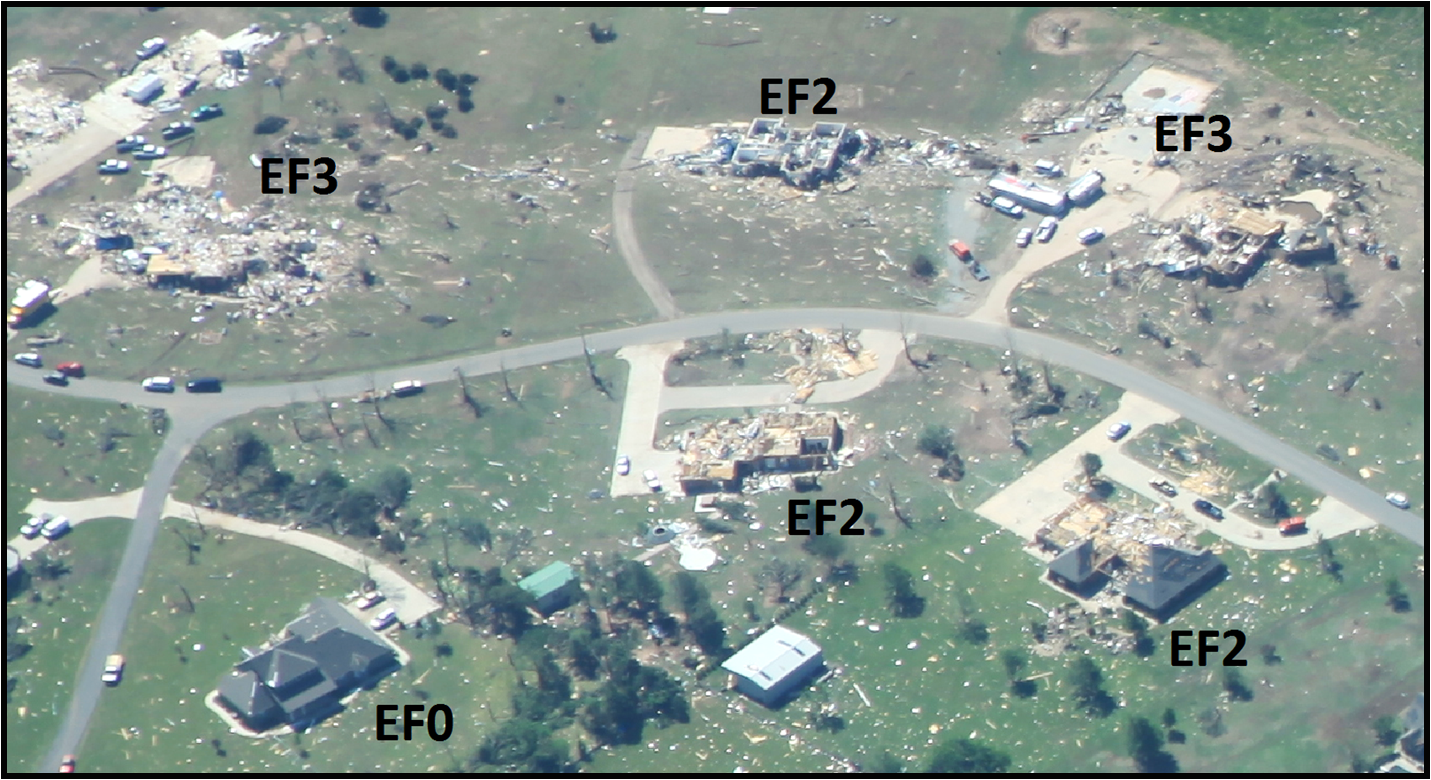
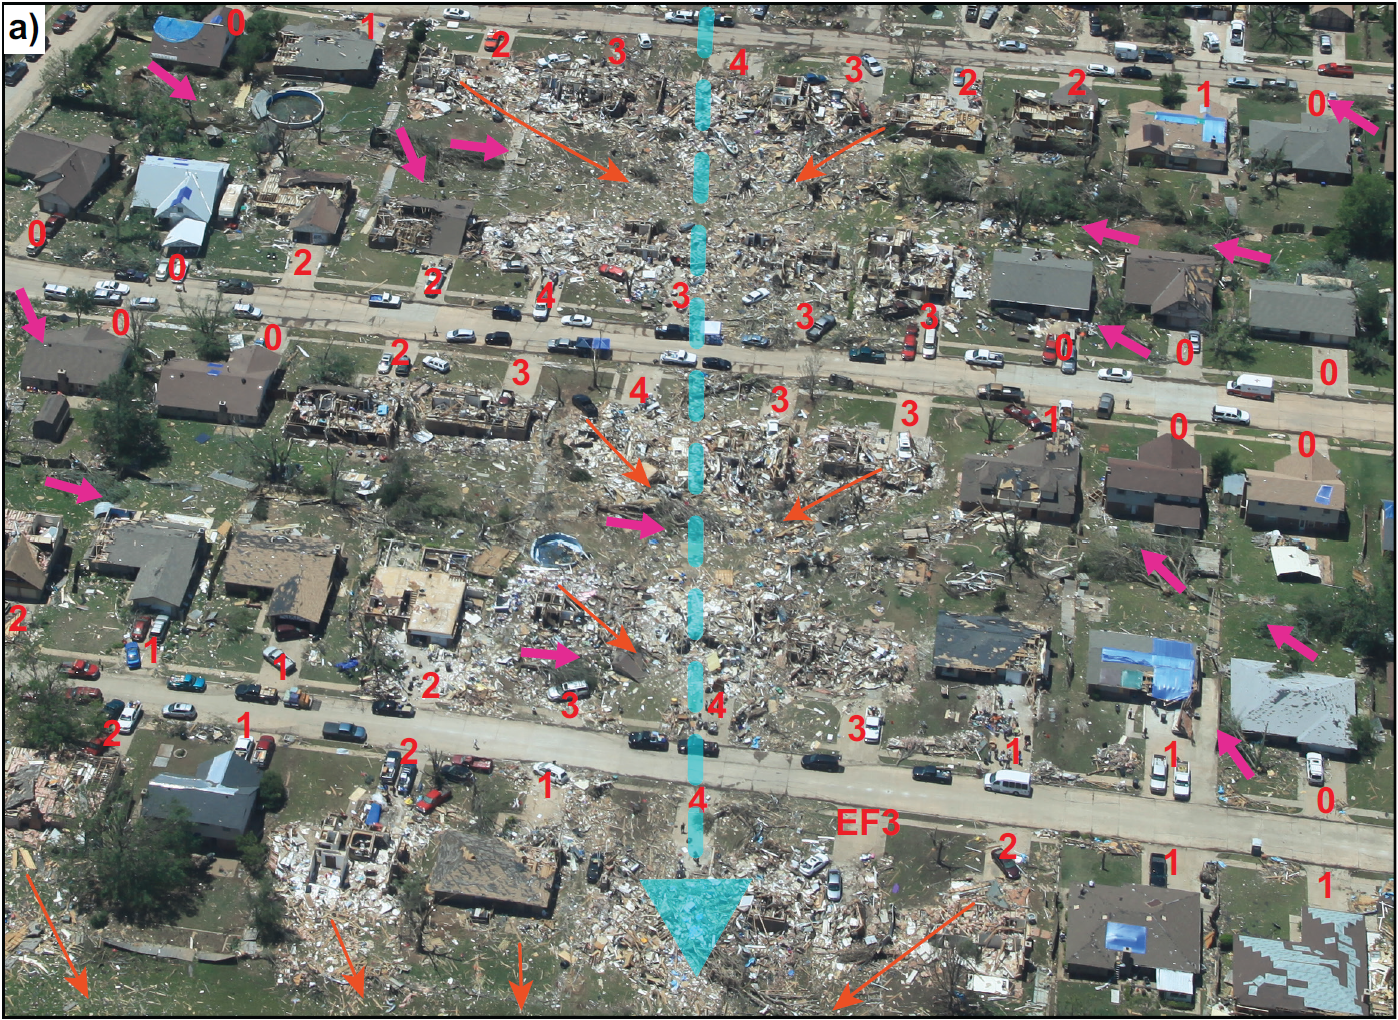
A more detailed analysis of the initial tornado wind field and attendant damage is shown in Fig. 2. The tornado produces EF4 damage, only 1.42 km from the damage path start, as it passed through a new subdivision, leveling four homes (upper left inset photo). The damage gradient is quite large. The distance from the centerline to the EF0 isopleth is about 250 m. The photogrammetric funnel size estimate is much smaller than the damage path width generally coinciding with the EF1 and EF2 isopleths. Previous research has revealed no consistent relationship between the condensation funnel size relative to the damage path width (e.g., Golden and Purcell 1978; Bluestein et al. 1997, 1998; Wakimoto et al. 2003). The tornadic wind field based on tree fall and debris is highly convergent toward the centerline. The large convergence is observed at radii (measured from the centerline) close to the funnel edge suggesting that the tornado radial flow (Vr) is larger than the tangential (Vt). Within the area of the condensation funnel, (also lower right inset photo), cyclonic flow is observed in the tree fall suggesting that Vt > Vr.
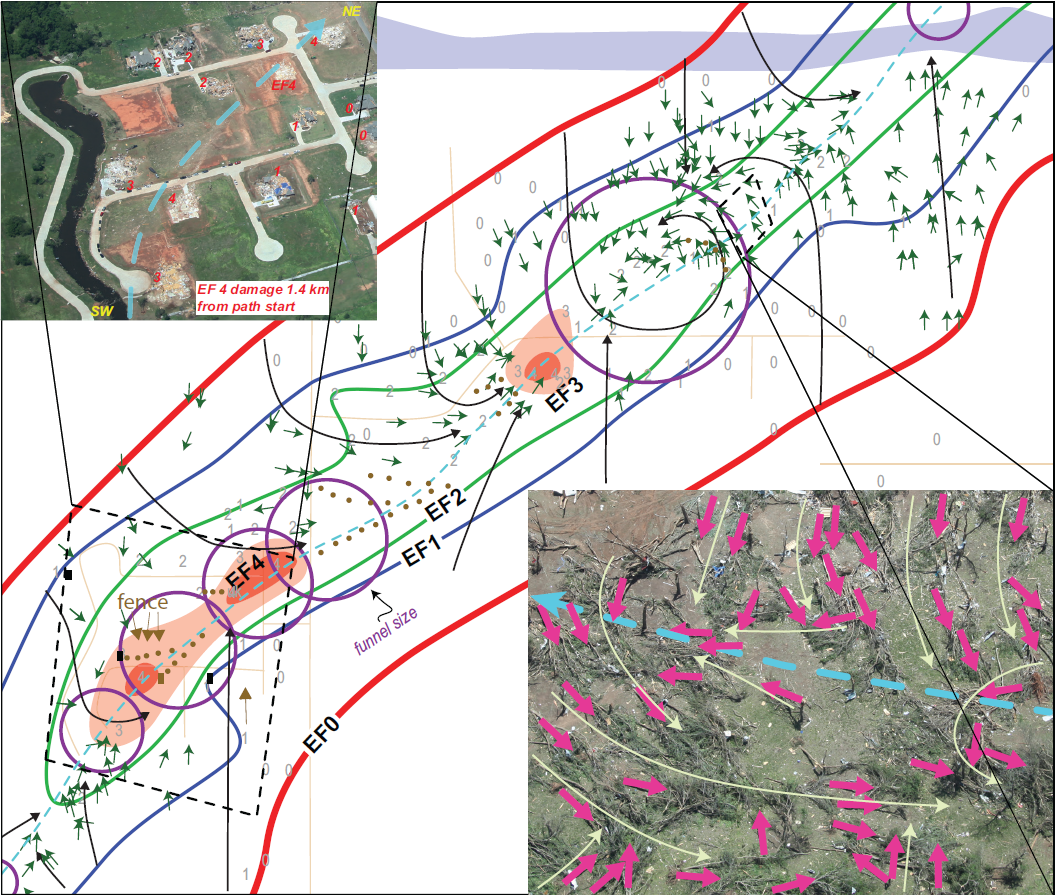
Figure 2. Damage survey analysis for the dashed magenta box closest to the damage path start in Fig. 1. In addition to the EF-scale isopleths, tree fall (green), EF-scale point values (gray), condensation funnel size (purple), tornado centerline (cyan), roads (light brown), and debris (brown), are all shown. Brown dots delineate debris paths. Brown arrows represent the direction of debris fall. The black dashed lines delineate the area of the respective aerial photos shown in the inset diagrams. Black curved lines highlight debris and tree fall directions. Point EF-scale values are shown in red in the upper left inset diagram. In the lower right inset diagram, tree fall direction (magenta), tornado centerline (cyan), and flow lines (light yellow), are shown.
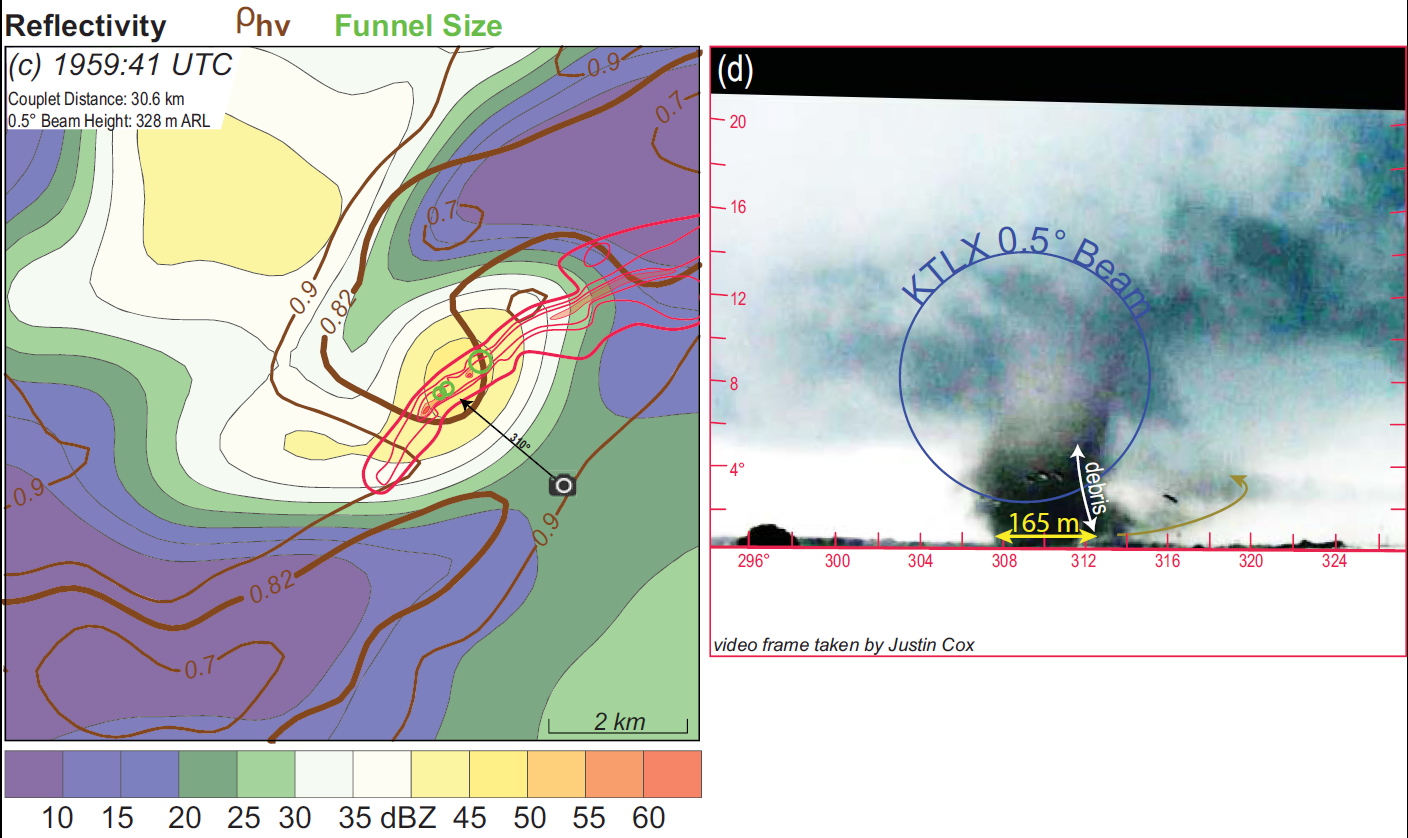
Radar and visual observations at and just after the time of initial damage (1955:27 UTC) are shown in Fig. 3a-d. The condensation funnel is just making contact with the ground (Fig. 3b). Previous studies have well-documented the ability of dual-polarized radars to detect tornado-generated debris by combining high radar reflectivity (Zhh), very low copolar cross-correlation coefficient (ρhv), and low differential reflectivity (ZDR) into a tornadic debris signature (TDS; e.g., Ryzhkov et al. 2002, 2005; Bluestein et al. 2007; Kumjian and Ryzhkov 2008; Snyder et al. 2010; Palmer et al. 2011; Bodine et al. 2013). A Zhh maximum is located near the beginning of the damage track and is collocated with ρhv values just less than 0.82. Bodine et al. (2013) examined dual-polarization data for two tornadic supercells with accompanying detailed damage surveys and found TDS thresholds for Zhh = 43 dBZ and ρhv = 0.82 collected at the lowest tilt (0.5°). Using the Bodine et al. (2013) thresholds, the TDS is marginal at the time of tornadogenesis. Four minutes later, the condensation funnel widens (Fig. 3d) and the tornadic winds strengthen, producing EF4 damage to residential structures. Lofted debris, the darkened portion of the condensation funnel in Fig. 3d, is observed near the ground. Video confirms that it is also centrifuged outward but not carried far above the ground. Despite the observed debris and EF4 damage, the TDS parameters do not change dramatically since 1955 UTC (Fig. 3c). The modest change in the TDS parameters may be explained by the fact that much of the KTLX beam (Fig. 3d) is located above the debris at 1959 UTC.

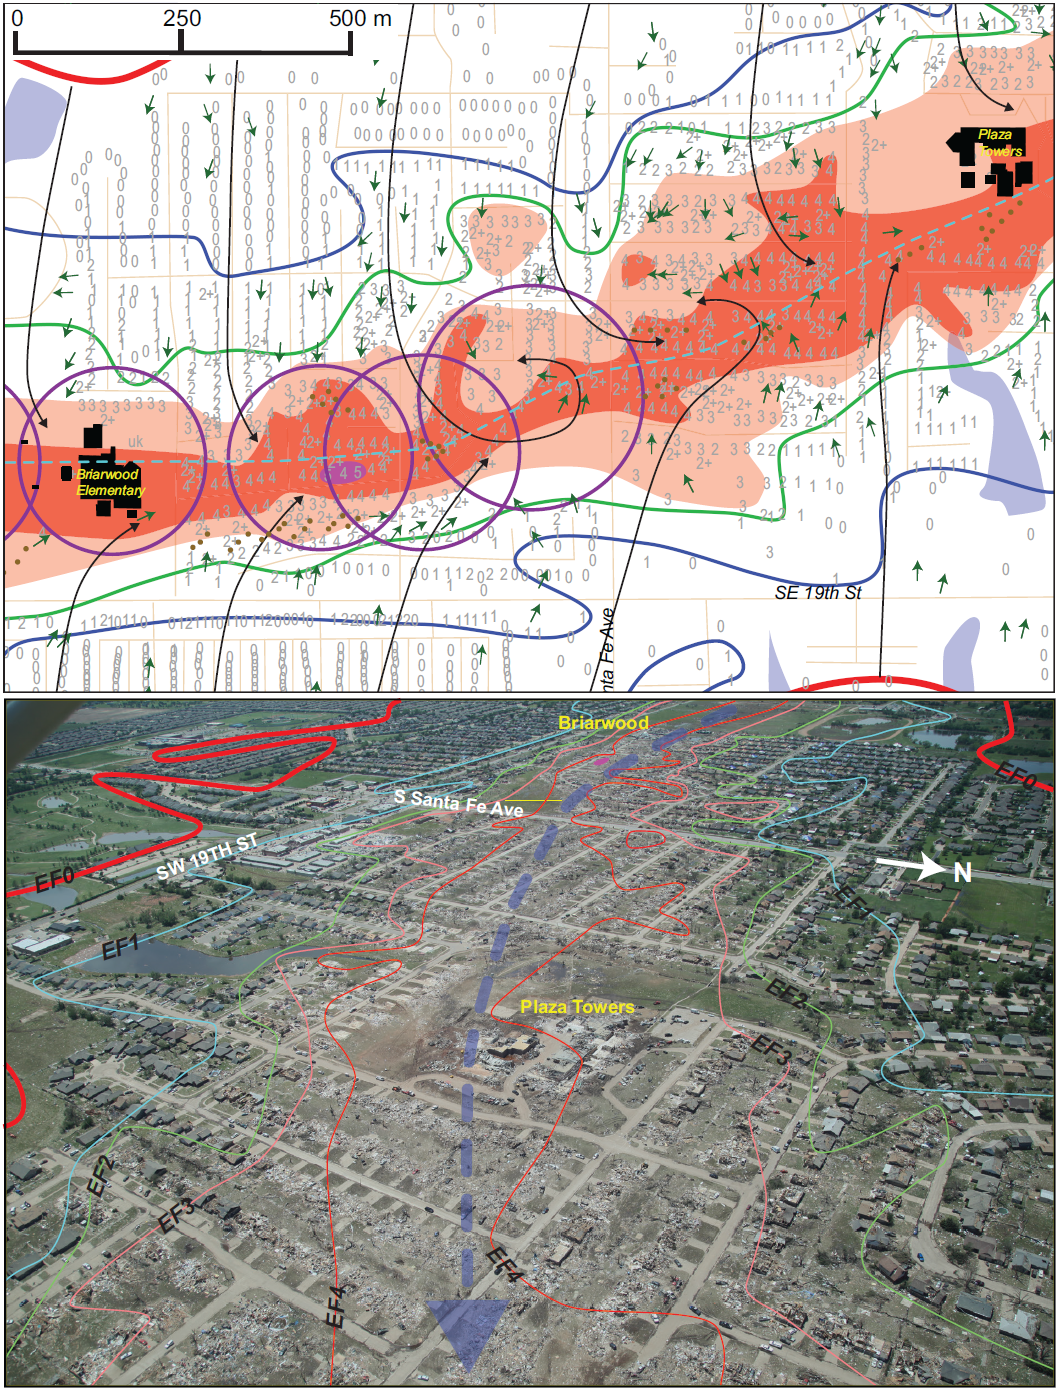
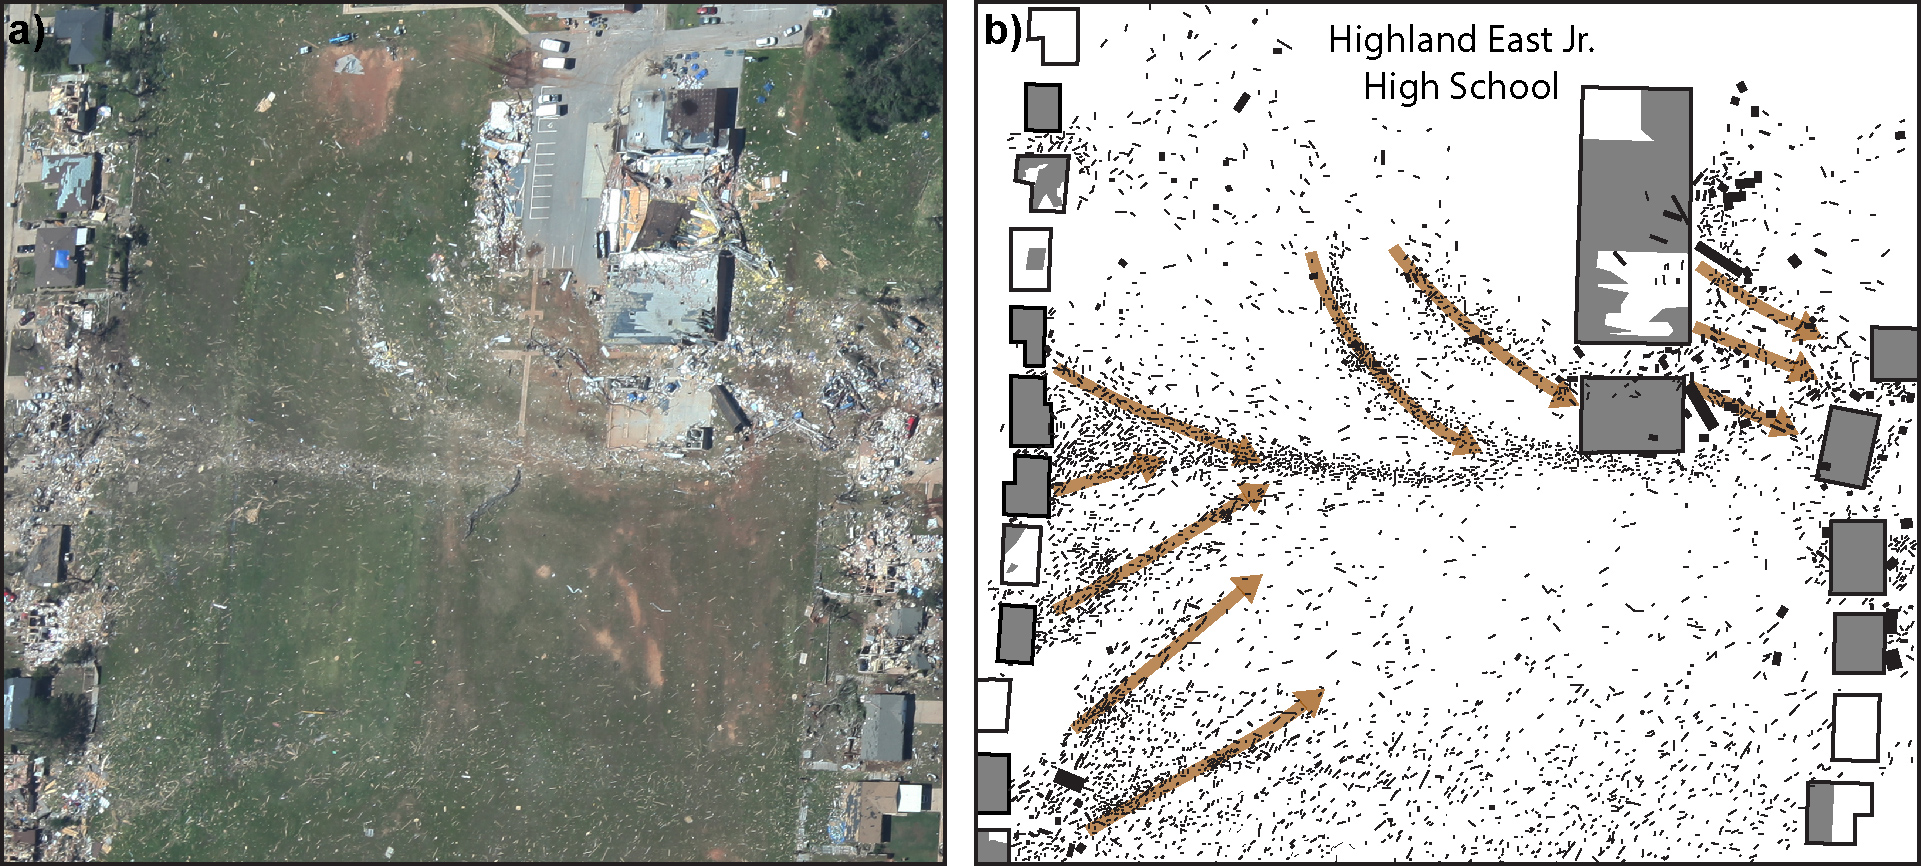
A portion of the damage path farther east encompassing the Briarwood and Plaza Towers elementary schools is shown in Fig. 4. Complete destruction of the Plaza Towers School along with suburban neighborhoods in Moore is evident in the aerial photograph. The small size of the condensation funnel relative to the damage path width is apparent. Highly convergent flow and attendant EF0-3 damage is observed from the outer edge of the damage path to within the condensation funnel (Fig. III). Karstens et al. (2013) also observed strongly convergent flow in tree fall associated with the 2011 Joplin (EF5) and Tuscaloosca-Birmingham (EF4) tornadoes. Lewellen et al. (2000) have simulated low-level tornadic winds that exhibit large ratios of Vr/Vt when the local corner flow swirl ratio is low. Large cyclonic curvature (Vt>Vr) is observed within the condensation funnel and generally coincident with the EF3 and EF4 damage near the path centerline (Fig. 4).
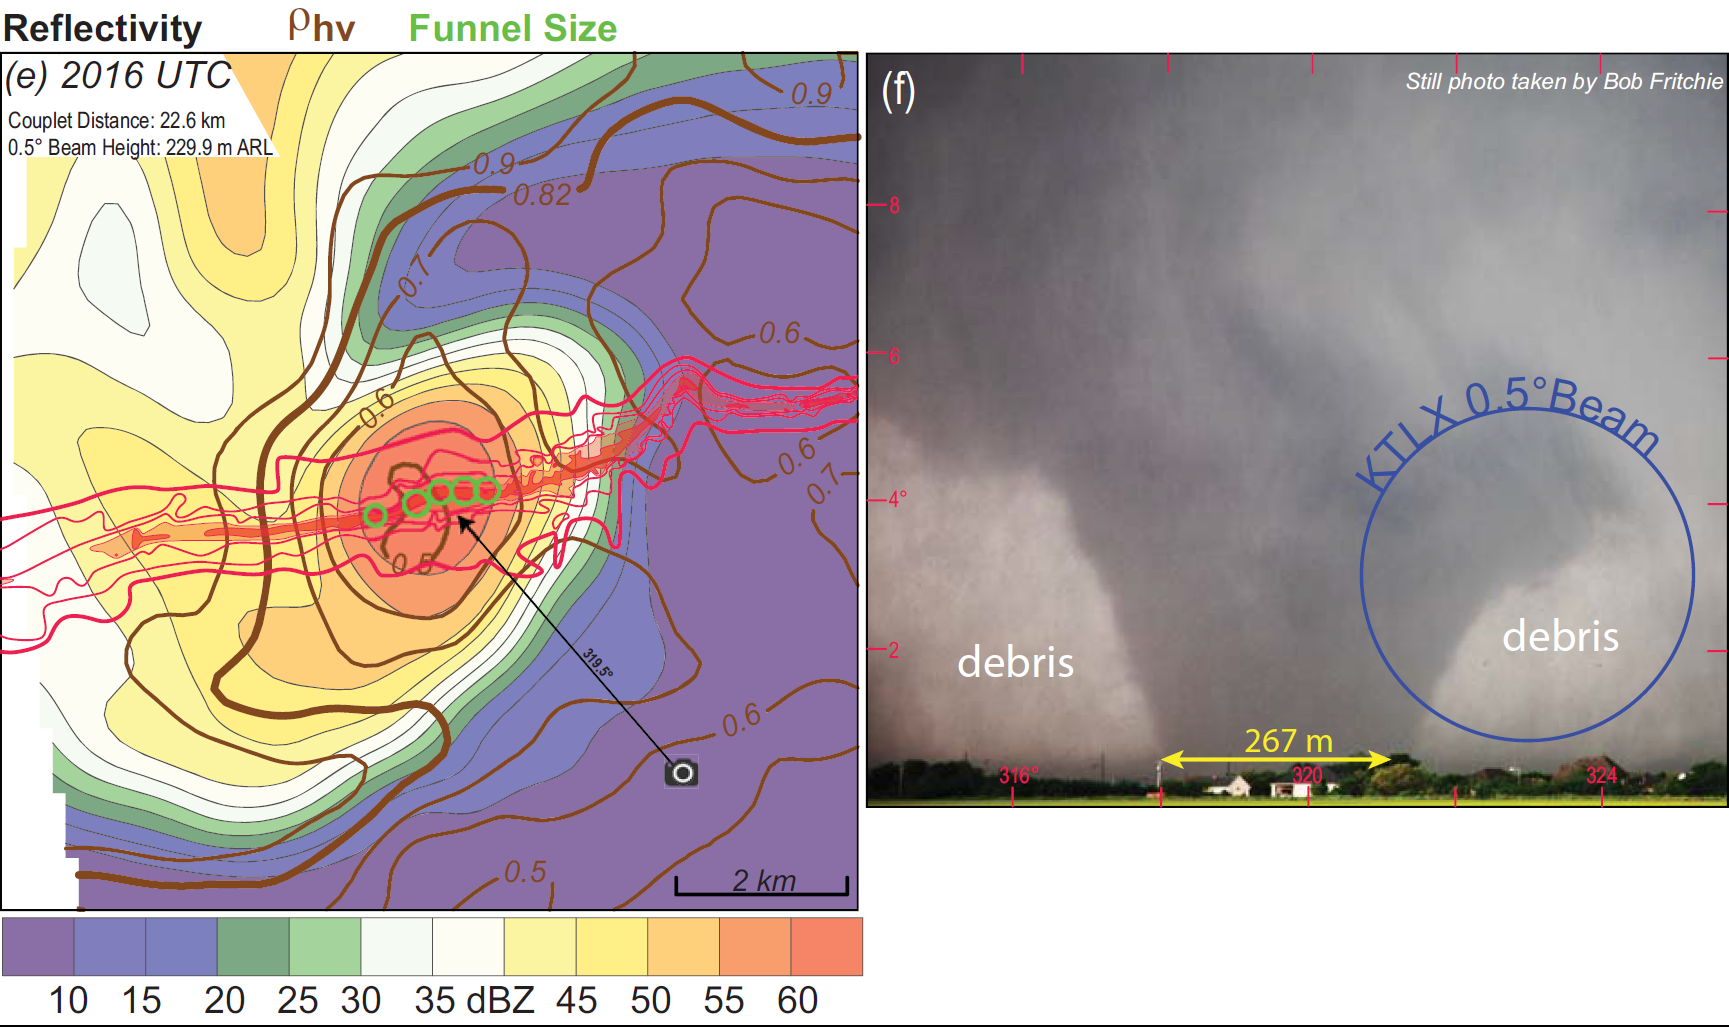
Radar (2016:43 UTC) and visual observations collected as the tornado approached the Briarwood elementary school are shown in Figs. 3e, f. The Zhh maximum increases in size and intensity since 1959 UTC and is again collocated with the damage track. The ρhv minimum decreases dramatically to values near 0.5 and is also collocated with the damage track. Striking in Fig. 3e is the relatively small size of the condensation funnel compared to the damage path and TDS. The condensation funnel diameter is estimated to be 18% and 8.4% of the width of the damage path and TDS, respectively. Bluestein et al. (2007) found that the visual extent of a debris cloud generally coincided with ρhv values indicating debris. Bodine et al. (2013) have shown that the TDS may be much larger than the damage path width. The authors are unaware of any study that has made quantitative comparisons between the dimensions of the collocated condensation funnel, damage path, and TDS.
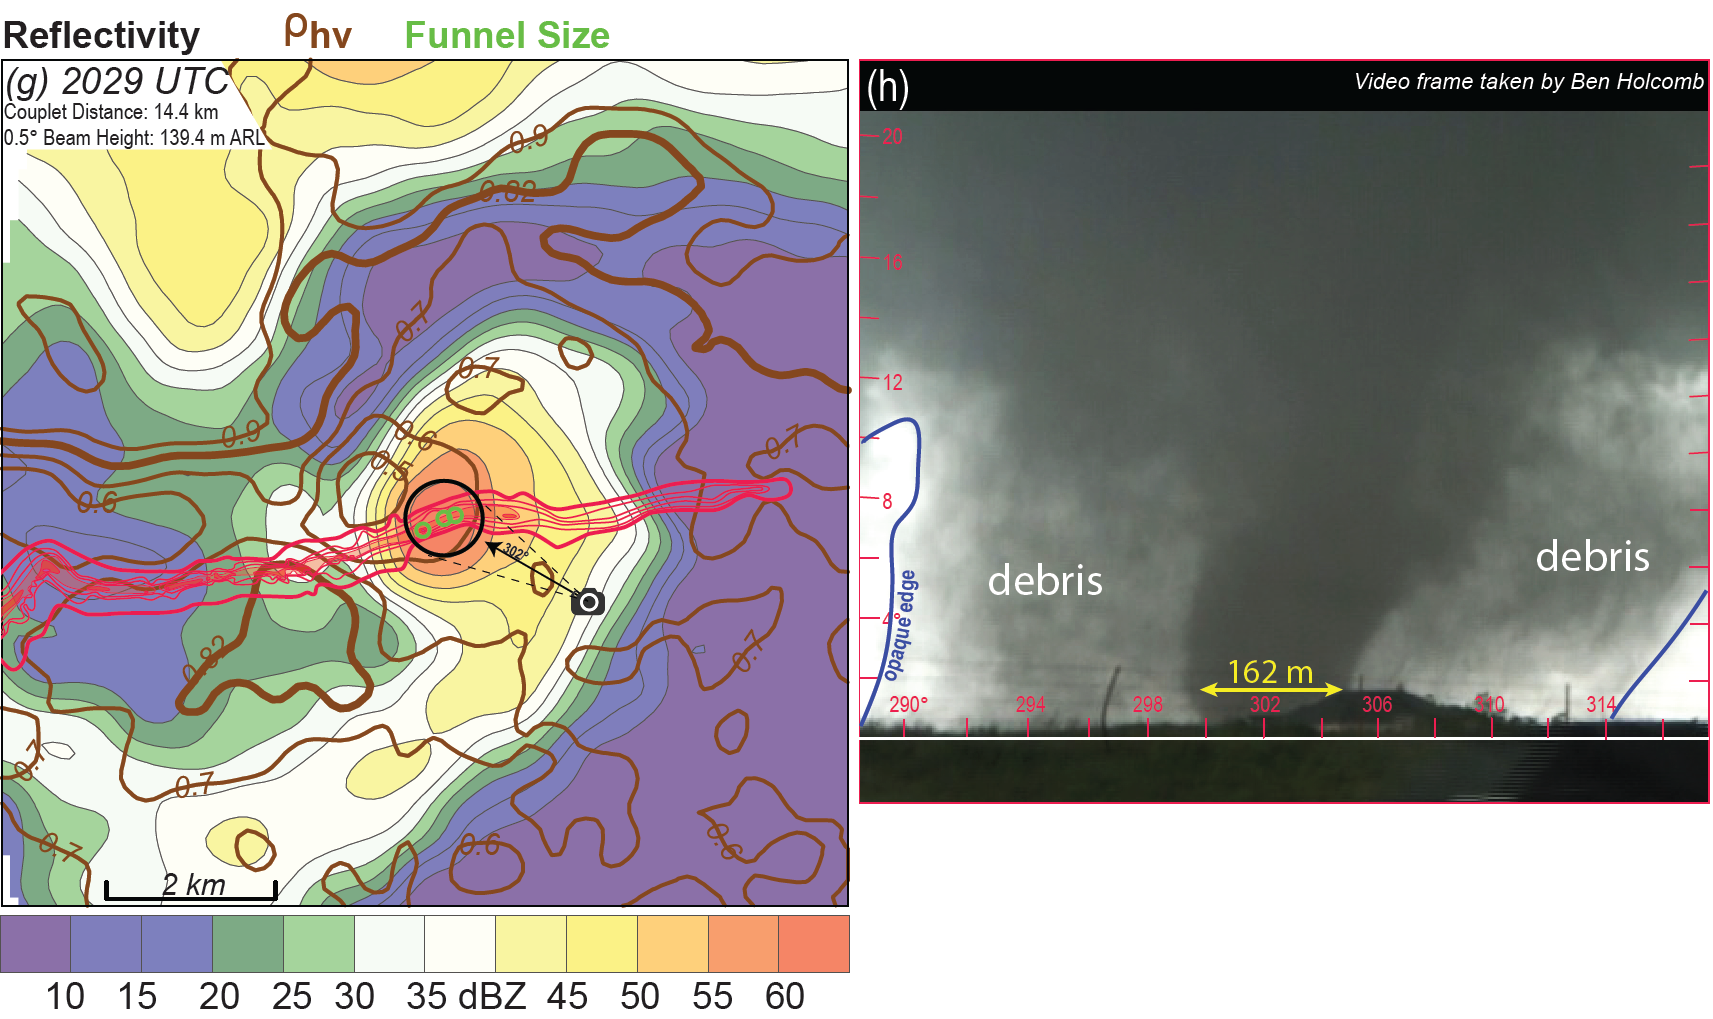
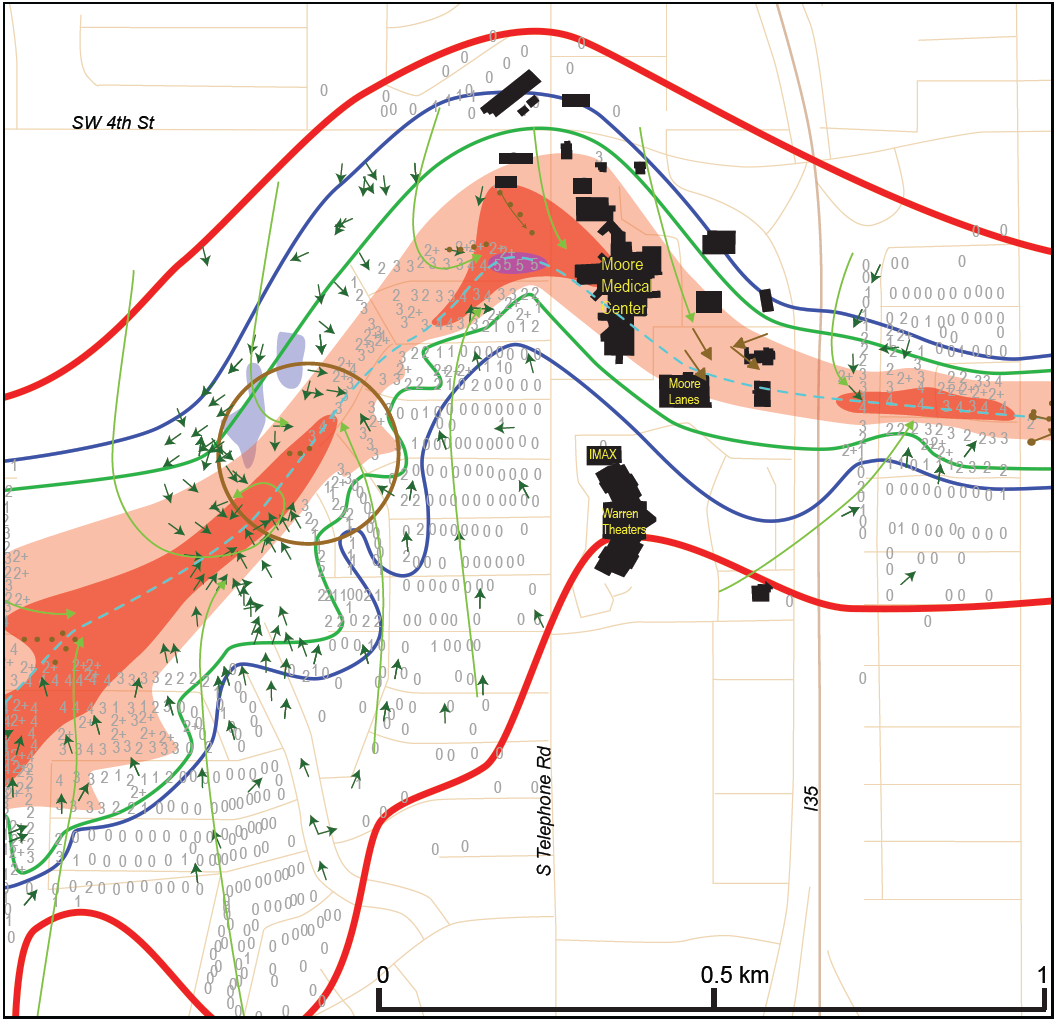
A prominent cusp in the damage path with embedded loop of the tornado centerline is observed just west of Interstate 35 (Fig. 5). The cusps and loops are created as the tornado revolves within its larger-scale parent circulation, the low-level mesocyclone (Fujita 1963; Agee et al. 1976; Brown and Knupp 1980). It is possible that the EF5 damage to the four 1 and 2 family residential structures just west of the Moore Medical Center is partially a result of the tornado looping just north of their location. These four homes are located on the right side of the tornado (relative to the tornado translation direction) where tornado translation and rotation create the strongest ground-relative wind speeds. The homes also experienced severe, damaging winds for a longer duration in a manner similar to the 1997 Jarrell Texas event (Houston and Wilhelmson 2007). The narrowing of the damage path, as the tornado moved east of Interstate 35 is evident in Fig. 5.
35.
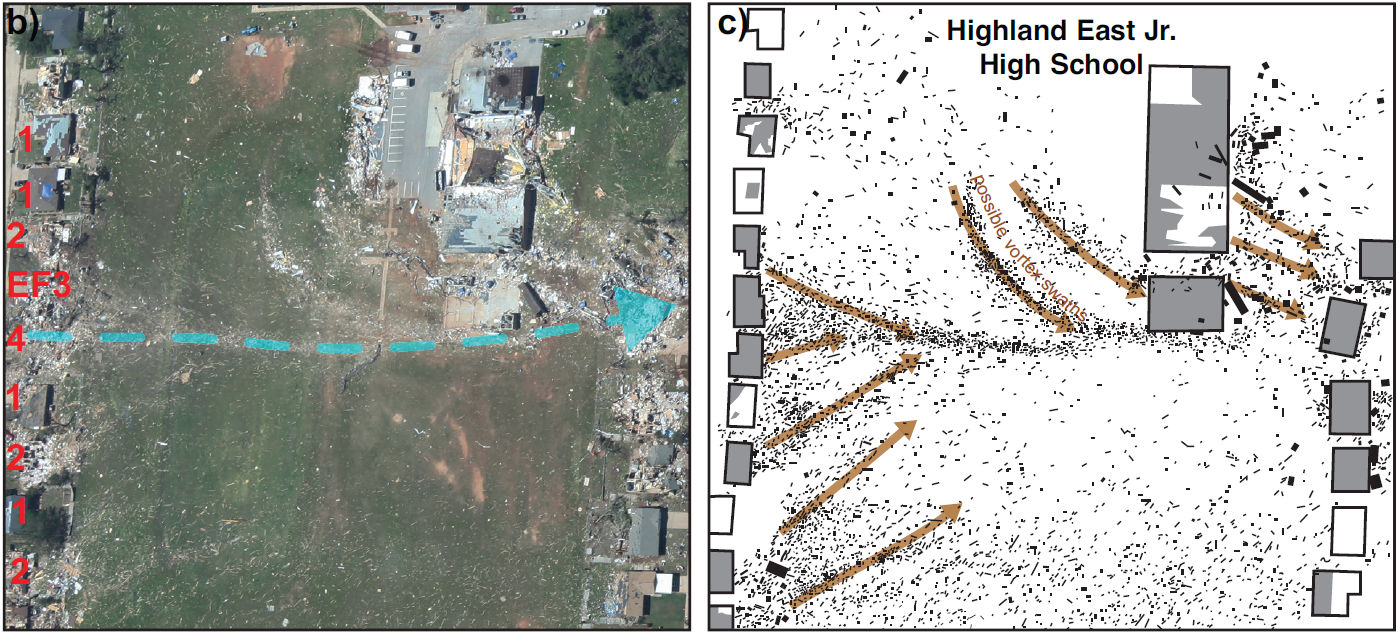
The large gradient of damage severity in the damage path between South Eastern and South Bryant Avenues in eastern Moore is evident in Fig. 6a. EF4 damage is observed near the tornado centerline (Fig. 6a). Moving either north or south from the centerline, the damage severity decreases by approximately one EF-scale value per house. Strong convergence of the tornadic winds is again implied in the tree-fall (Fig. 6a). The only evidence that the Moore tornado may have produced smaller-scale multiple vortices is observed near the Highland East Jr. High School in Fig. 6b and c. Swaths of debris north of the tornado centerline and just west of the school are evident. The authors are unaware of any visual data to confirm the presence of multiple vortices associated with the Moore tornado. Video and photos documenting the tornado along the eastern portion of the damage path confirm that it was a single vortex (not shown). It is possible that the debris swaths in Fig. 6 are produced by radial inflow rolls as discussed in Lewellen and Zimmerman (2008).
Quantifying Damage Risk
An attempt was made to quantify the risk associated with the Moore tornado and compare it with other well-surveyed EF5 tornadoes.
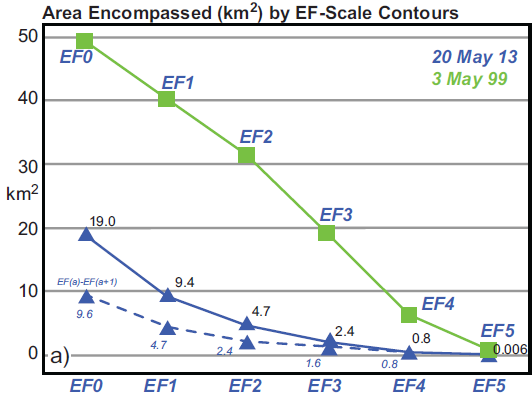
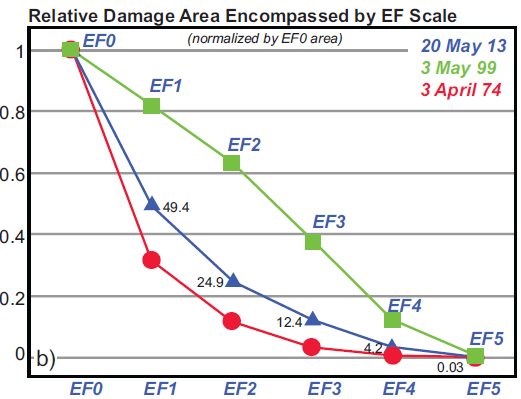
Fig. 7a illustrates the difference in damage areas between the F5 3 May 1999 Bridge Creek-Moore (Speheger et al. 2002) and the 2013 Moore tornado. The Bridge Creek-Moore tornado encompasses more area for each EF-scale category, attributable to the longer path length (61 km). Because the Bridge Creek-Moore tornado traversed more rural area lacking damage indicators compared to the Moore tornado, the respective EF-scale damage areas shown in Fig. 7a may be even larger. Interestingly, the Bridge Creek-Moore tornado damage area increases linearly by about 20% for each successively smaller EF-scale rating. Whereas, the Moore tornado damage area exponentially increases with decreasing EF-scale rating (Fig. 7b). Abbey and Fujita (1975) observed a similar exponential increase of damage area with decreasing F-scale for F5 tornadoes surveyed during the 3 April 1974 super outbreak (Fig. 7b). While the generality of these results is not known, they begin to shed some light on the inherent risk associated with EF5 tornadoes. For example, if it is assumed that residential structures rated EF2 or higher are catastrophically damaged, one would expect this over 25% of the total damage area using the 20 May 2013 data.
Fig. 7a illustrates the difference in damage areas between the F5 3 May 1999 Bridge Creek-Moore (Speheger et al. 2002) and the 2013 Moore tornado. The Bridge Creek-Moore tornado encompasses more area for each EF-scale category, attributable to the longer path length (61 km). Because the Bridge Creek-Moore tornado traversed more rural area lacking damage indicators compared to the Moore tornado, the respective EF-scale damage areas shown in Fig. 7a may be even larger. Interestingly, the Bridge Creek-Moore tornado damage area increases linearly by about 20% for each successively smaller EF-scale rating. Whereas, the Moore tornado damage area exponentially increases with decreasing EF-scale rating (Fig. 7b). Abbey and Fujita (1975) observed a similar exponential increase of damage area with decreasing F-scale for F5 tornadoes surveyed during the 3 April 1974 super outbreak (Fig. 7b). While the generality of these results is not known, they begin to shed some light on the inherent risk associated with EF5 tornadoes. For example, if it is assumed that residential structures rated EF2 or higher are catastrophically damaged, one would expect this over 25% of the total damage area using the 20 May 2013 data.
Comparison Between Aerial and Ground Damage Surveys
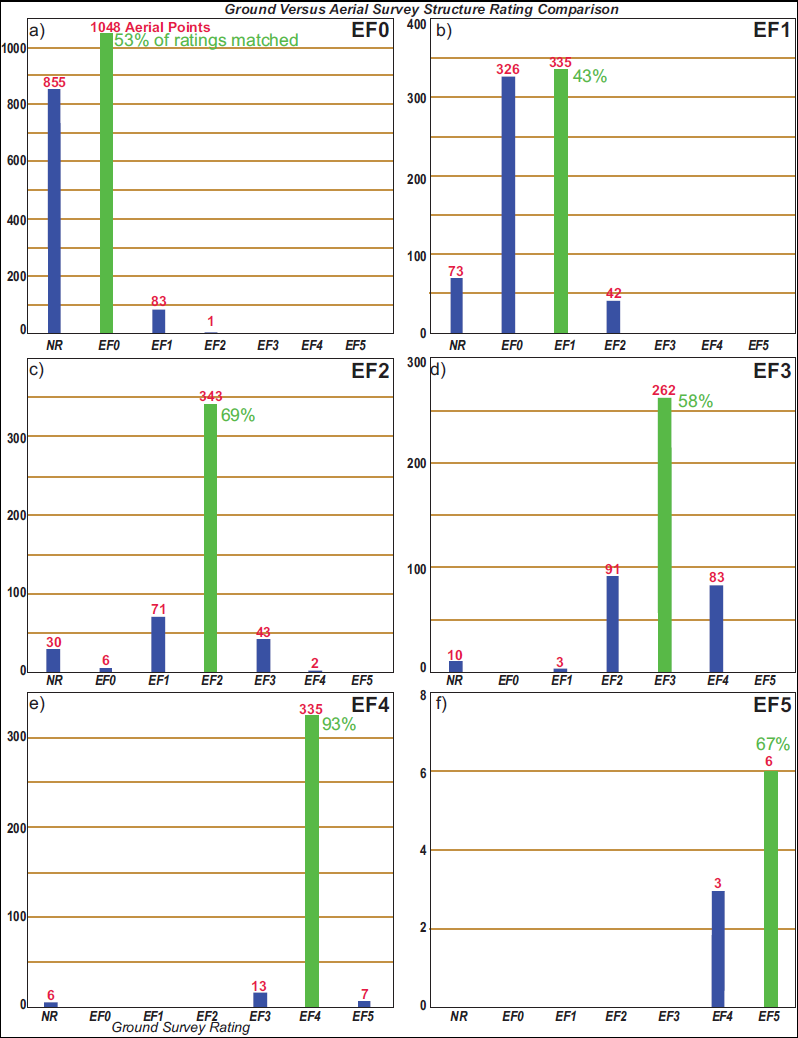
A unique opportunity exists to compare the independent aerial and ground survey results to identify biases. This is especially important in light of recent attempts to use high-resolution aerial and satellite data to map out the damage spatial distribution produced by tornadoes (Brown 2010; Edwards et al. 2013). The two surveys analyzed herein are the aerial and ground surveys performed by the authors and the National Weather Center teams, respectively. Both surveys independently identified and rated 4077 common point structures along the entire damage path. The comparison of over 4000 common EF ratings in two independent damage surveys believed to be unprecedented.
Beginning with the ground EF0-rated points (Fig. 8a), while nearly 1050 points are also rated EF0 in the aerial survey, a large fraction are not identified as damaged (NR = no rating). This is attributed to the ground survey identifying “threshold of visible damage”, or degree of damage 1 (DoD1) to many residential structures that was not visible from the air. A similar low bias in aerial rating is observed for EF1 points. Nearly as many points are rated EF0 as EF1 in the aerial survey. Many of the aerial rated EF0 points are residential structures with minimal roof damage (DoD2). Yet, the ground survey identified “broken glass in windows and doors” (DoD3), or EF1 damage. While it is possible that debris generated by the tornado may be partially responsible for damaging structures in each EF category, it may be especially true for the EF0 and EF1-rated damage that was not obvious in the aerial photographs. The ground and aerial surveys are relatively consistent in rating structures EF2 (Fig. 8c) and EF3 (Fig. 8d) with slightly larger variance in the EF3 ratings. The ground and aerial surveys are very consistent rating EF4 (Fig. 8e) structures. Quantitative comparison of the small number (11) of structures rated EF5 (Fig. 8f) is not possible. Furthermore, it is not good practice to rate one and two family residential structures that appear to be swept clean of the foundation EF5 solely from aerial photographs. A ground assessment of how the structure(s) was built is essential.
Summary and Conclusions
An integrated damage, visual, and dual-polarized radar analysis of the 20 May 2013 Moore Oklahoma EF5 tornado has been presented. The damage path is 23.25 km long and a maximum width of 1.74 km. Approximately 4531 structures were damaged by the tornado over an area of 19.04 km^2. The near-surface tornado wind field is characterized by highly convergent flow over the majority of the damage path. At times, it appears that Vr>Vt at radii (measured from the damage path centerline) extending from the EF0 isopleth to less than the outer edge of the condensation funnel.
The KTLX WSR-88D dual-polarized radar detected a tornado debris signature that is not well correlated with a rapid increase from EF1 to EF4 damage near the time of tornadogenesis. Photogrammetric estimates of debris height from concurrent video observations show that much of the beam was above the debris. While the debris was being centrifuged outward, low-level updrafts were not sufficiently strong enough to loft the debris to heights where it was detectable by KTLX. This is a noteworthy observation as the tornado was only 30 km from the radar. Close to the time of maximum intensity and width, the TDS is well defined and collocated with the damage path and condensation funnel but exhibits a much larger spatial scale due to debris centrifuging. A detailed comparison of the widths of the TDS and condensation funnel and their relationship with the damage path is documented for the first time.
The distribution of damage within the overall path is presented. The damage area increases exponentially with decreasing EF-scale rating. This finding is consistent with F5 tornadoes surveyed as part of the 3 April 1974 super outbreak. It differs from the 1999 Bridge Creek-Moore tornado damage area that increases linearly by about 20% for each successively smaller EF-scale rating. Only 25% of the Moore tornado damage area is rated EF2 or higher.
A comparison of independent ground and aerial damage surveys is presented. The aerial survey contains a low bias for structures rated EF0 and 1 in the ground survey. This is largely attributed to the difficulty in observing weak damage, DoD1 (EF0) and DoD3 (EF1), to residential structures from overhead aerial photos. It may be possible to see this damage from high-resolution aerial photos taken at low-level oblique angles. Future aerial damage surveys should consider both overhead and oblique viewing angles. Structures rated EF2 and 3 compare reasonably well given the well-known difficulties of assigning damage ratings to structures (Edwards et al. 2013). Structures rated EF4 are very consistent between the ground and aerial surveys. The small number (10) of structures rated EF5 precludes quantitative comparison.
Despite the apparent low bias in rating residential structures with aerial photographs, future survey efforts should, if possible, be conducted with both aerial and ground survey teams. In the future, it may be possible to replace aerial survey imagery collected utilizing techniques pioneered by Ted Fujita (e.g., Fujita 1970) with commercially available high-resolution ortho and oblique imagery taken by aircraft and satellites immediately after an event. Ground teams are needed to assess structural engineering integrity, document the role of debris impact, and interviewing individuals who can offer insight into the structure characteristics and possibly the tornado. On the other hand, aerial surveys can cover the damage path much more quickly. This is especially important for tornado outbreaks or long-track tornadoes where completing detailed ground surveys in a timely manner would not be possible. Covering a damage path quickly and completely is important since debris is often cleaned up immediately after the event. Furthermore, aerial surveys can reveal damage patterns in open terrain such as suction vortex swaths and cusps (e.g., Fujita 1981; Wakimoto et al. 2003) that would not be visible on the ground. This is true for the 31 May 2013 El Reno tornado.
Integrating visual and damage data with close range dual-polarized radar observations of EF5 tornadoes reveals new insights on the structure and evolution of the tornado, attendant debris, and the low-level wind field. While observations from the KTLX radar are presented herein, other nearby radars, including the Oklahoma City Terminal Doppler Weather Radar (TOKC) collected data during the entire life cycle of the Moore tornado. The range from TOKC to the tornado varied from 5–13 km. An important research question concerning tornadoes is observing the near surface wind field. Future work will focus on retrieving the low-level axisymmetric wind field from the TOKC radar using the Ground-Based Velocity Track Display (GBVTD) technique (Lee et al. 1999) and compare it with photogrammetric estimates of horizontal and vertical velocities from video and qualitatively with tree fall observations in the damage survey.
¨ The University of Oklahoma Advanced Radar Research Center deployed the mobile PX-1000 X-band radar on the Moore tornado. Data and deployments are summarized in Kurdzo et al. (2014).
˜ Damage (EF0) consistent with weak tornadic rotation was observed up to 5.2 km to the southwest of the damage path start in Fig. 1.