Isobaric Charts
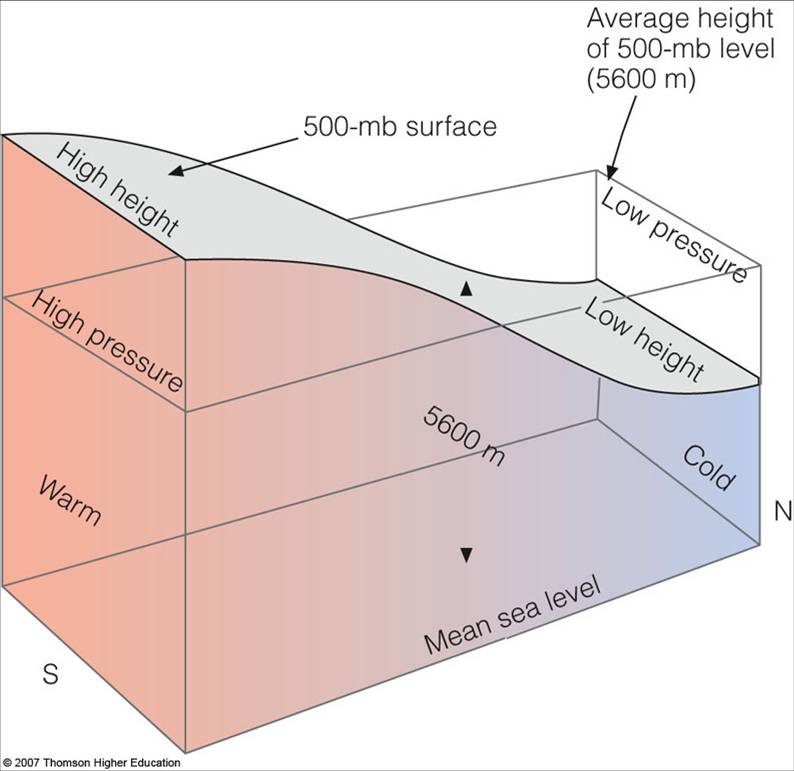
First, recall that the tropospheric depth is proportional to the mean tropospheric temperature:
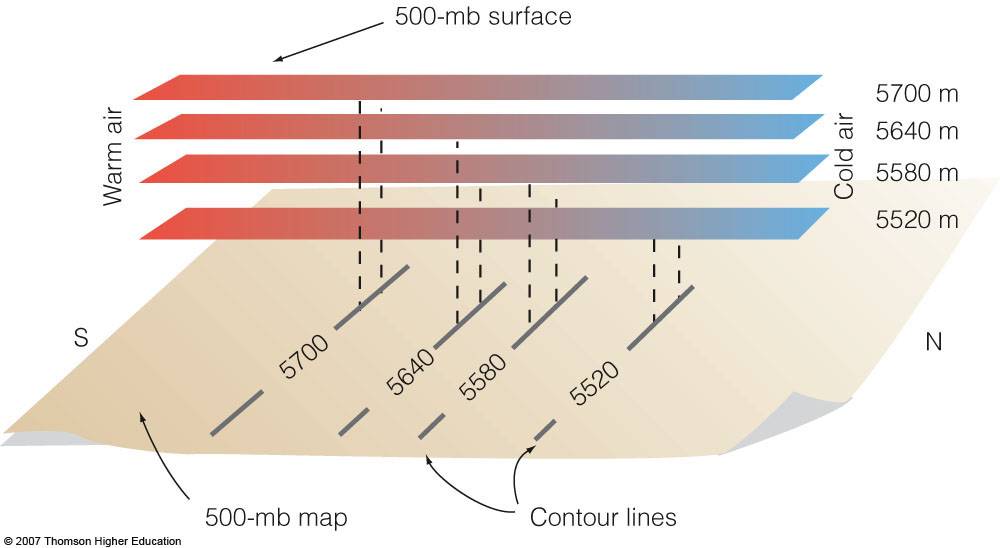
As shown to the right -->> the 500 mb surface will be located at higher levels further south and at lower levels further north
Hence, on an isobaric chart (e.g., 500mb) we plot isopleths of the height of the surface.
Let's look at an example.....