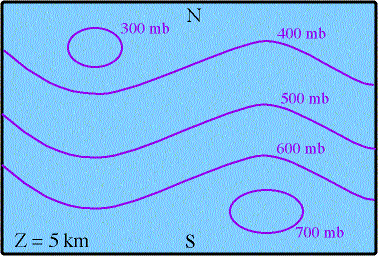
Representing pressure above the surface - Z = 5 km
Q: What would the pressure pattern on a constant height chart look like if Z = 5km??
A: Pressure would decrease as you move northward
This type of chart is not used much in Meteorology
constant pressure charts, however, are used extensively...., so let's examine these in greater detail.....
