INSTRUCTIONS ON HOW TO
ANALYZE THE PIBAL LAB DATA
- Strip Chart Interpretation
- Wind Calculations
Strip Chart Interpretation
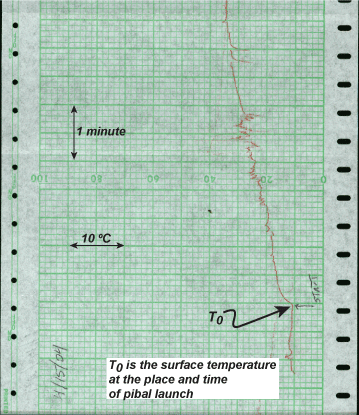
Refer to the diagram to the right for how to interpret the
strip chart.
- The horizontal axis is temperature. Each major line
(1 cm) is equal to 5 degrees Celsius.
- The vertical axis is time or height. Each major line
(also 1 cm) is equal to 30 seconds of time. Assuming an ascent rate of
600 feet per minute, then each major line is also 300 feet.
- T0 is the initial temperature at the time and
place the pibal was launched. The temperature scale is then set relative
to the value of T0 .
Wind Calculations
- To calculate the horizontal winds, the
three-dimensional position of the balloon must be known at given times.
- The vertical height of the balloon is known relative to the
launch time since this particular size of pibal ascends at 600 feet per
minute.
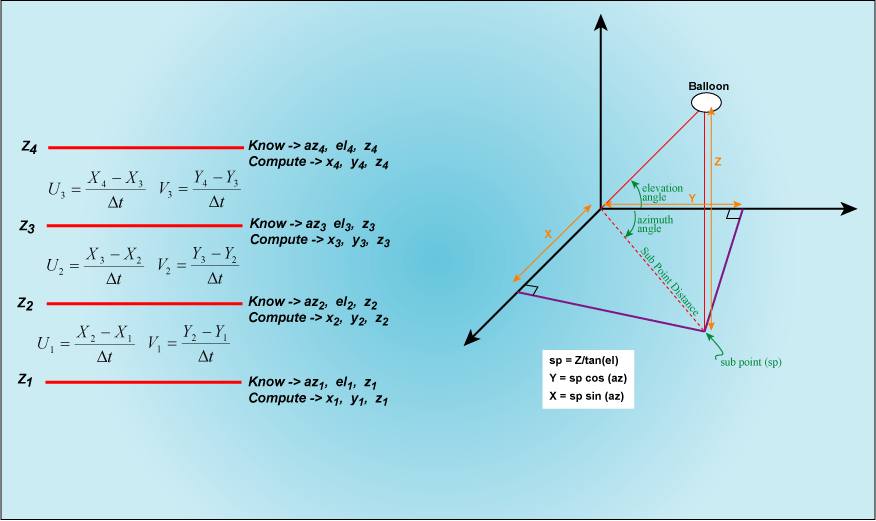
- The horizontal positions of the balloon can be found
through trigonometry. Refer to the diagram to the below.


